Here are steps you can take to improve the air quality in your workplace, a cost effective and reliable method to safeguard employee wellbeing and maximise productivity.
Why does indoor air quality matter?
Ensuring sufficient fresh air is provided to employees is a highly effective method of reducing the risk of viral transmission in the workplace. Virus laden aerosols build up within spaces as their inhabitants respire, meaning it is imperative that fresh air is regularly circulated to keep employees safe.
Additionally, increased CO2 levels – a byproduct of respiration – have been shown to impact cognitive ability, increasing the likelihood of erroneous decision making by 25% in elite chess players.
Clearly, ensuring that IAQ levels remain optimal is highly beneficial to organisations seeking to safeguard their employees’ wellbeing and provide them with the best working environment.

The 3 pillars of IAQ
Air quality can be broken down into three core aspects which impact wellbeing and cognitive ability.
Temperature & Humidity
These factors impact both viral survivability and our immune response to infection. Maintaining the following benchmarks gives our bodies the best chance of staving off viruses whilst creating the least hospitable environment for a virus:
- Temperature: 21°C
- Relative humidity: 40-60%
CO2 Levels
Monitoring CO2 levels is an indicator of how fresh the air within a space is, the more frequently fresh air is circulated within a space the closer CO2 levels will be to the natural composition of our air. Organisations should aim to maintain a CO2 level of 300-500ppm.
How to improve the rate of fresh air with occupancy and air quality data
There are 3 key steps to take to ensure that IAQ remains within the optimal levels, and ensure that organisations have visibility of and control over the factors impacting it.
1 – Data gathering
In order to improve air quality, organisations need to gather continuous occupancy and environmental data. The first step in improving IAQ is having clear visibility throughout the workplace.
Deploying sensors which gather data in real time enables teams to respond immediately to dangerous spikes and identify trends throughout the week. Introducing a sensor solution incorporating the following sensors will provide the data and visibility necessary:
- Air quality sensors – Monitoring CO2, temperature and humidity, these sensors continuously report on the air quality throughout a space.
- Occupancy sensors – Deployed across assets throughout the workplace, these sensors add an extra layer of insight into air quality levels, enabling teams to understand the impact of human behaviour on IAQ.
2 – Redistributing occupancy levels
Here is some data that highlights how office occupancy has impacted CO2 level throughout the week.
Clear trends are identifiable throughout the week, with higher occupancy levels in the midweek days corresponding to severe peaks in CO2 levels which are indicative of stale air which poses a risk to employees.

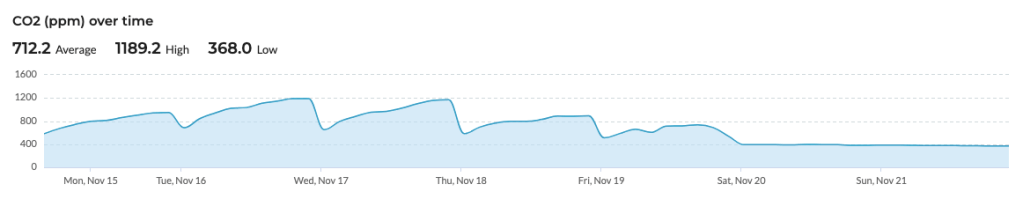
Figure 1: Occupancy and CO2 levels across the week
There are numerous ways in which occupancy data can be analysed to avoid these peaks and bring averages down to a lower and safer level:
- Spread occupancy evenly throughout the week – occupancy data enables teams to understand which days are popular with employees, and enables evidence based decisions to be made in redistributing usage throughout the week.
- Identify highly utilised areas within the workplace – understanding which floors or areas of the office are highly populated provides teams with the ability to better allocate space and devise plans to encourage equal utilisation of assets to avoid highly concentrated areas.
- Identify popular workplace assets – by understanding which types of spaces are most commonly used teams can work to repurpose underutilised assets to help spread occupancy across spaces.
- Understand departmental behaviours – looking at occupancy through a departmental lens can avoid overcrowding by identifying which teams require more space, and where the opportunities for change in the office lie.
3 – Adjusting HVAC performance
A key takeaway from the CO2 and occupancy graphs above is to note the steady increase of CO2 levels throughout the day despite occupancy remaining steady. This is a clear indication that ventilation systems are not providing nearly enough fresh air.
Ventilation systems need to be providing at least 10 litres of fresh air per person, per second in order for a CO2 level of 300-500ppm to be maintained.
How to calculate how much fresh air is needed
Using occupancy data, teams can fine tune their ventilation systems by working out how many air changes per hour and thus, the necessary volumetric flow rate of air to ensure that fresh air is being sufficiently provided.
Calculating air changes per hour (acph)

rp = ventilation rate per person = 10 litres per person, per sec
d = occupant density = square metre per occupancy
h = ceiling height (metres)
Calculating volumetric flow rate (q)
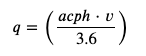
q = volumetric flow rate (L/s)
v = volume of space in cubic metres
acph = air changes per hour per person
Leveraging the above information enables teams to approach either the internal team responsible for HVAC systems or their building managers and make the changes required to ensure that fresh air is being provided at the appropriate rate.
Contact us
Get in touch and let us help you navigate and define your workplace strategy.